THE BIG NUMBER
3.89
×
Spend-weighted iROAS
Across measured BFCM campaigns in every vertical, retargeting and retention combined.
See performance ↗As far as we know, still the only BFCM direct mail report built on holdout-tested data.
Real transactional data from thousands of brands. Holdout-tested wherever possible.

Holdout-tested wherever possible, reported at the median. It’s the most conservative way to show what mail actually drove.
Across measured BFCM campaigns in every vertical, retargeting and retention combined.
See performance ↗Than comparable one-off campaigns, plus 1.9× the incremental conversion lift per recipient.
See automation ↗Medians peaked at 7.09–7.65× in the 31–60 day window, and positive returns held for customers who last bought more than two years ago.
See recency ↗The highest median iROAS of any tier: +127% vs. the $1k–$5k entry tier.
See spend tiers ↗Every digital message has a half-life rarely longer than the flick of a thumb. A mailer has to be held, looked at and dealt with. Here’s what that’s worth at each funnel stage, Oct 1–Nov 20, 2025.
INCREMENTAL ROAS
INCREMENTAL ROAS
MailMatch™ reaches a physical address with an email alone - helping turn abandoned carts and checkouts into first purchases.
Cart & checkout retargeting
MEDIAN ROAS
All retargeting
Cart & checkout / MailMatch™
Median incremental return on ad spend
Time one or more postcards to land after your email and SMS welcome series ends.
Nudge almost-buyers at the end of your abandoned cart series with a postcard (or two).
Target shoppers who filled out shipping info but left before paying.
Median retention returns by days since last order, from 15 days to two years+. Recency is the strongest predictor of repurchase, but “lapsed” goes a lot further back than most brands think.
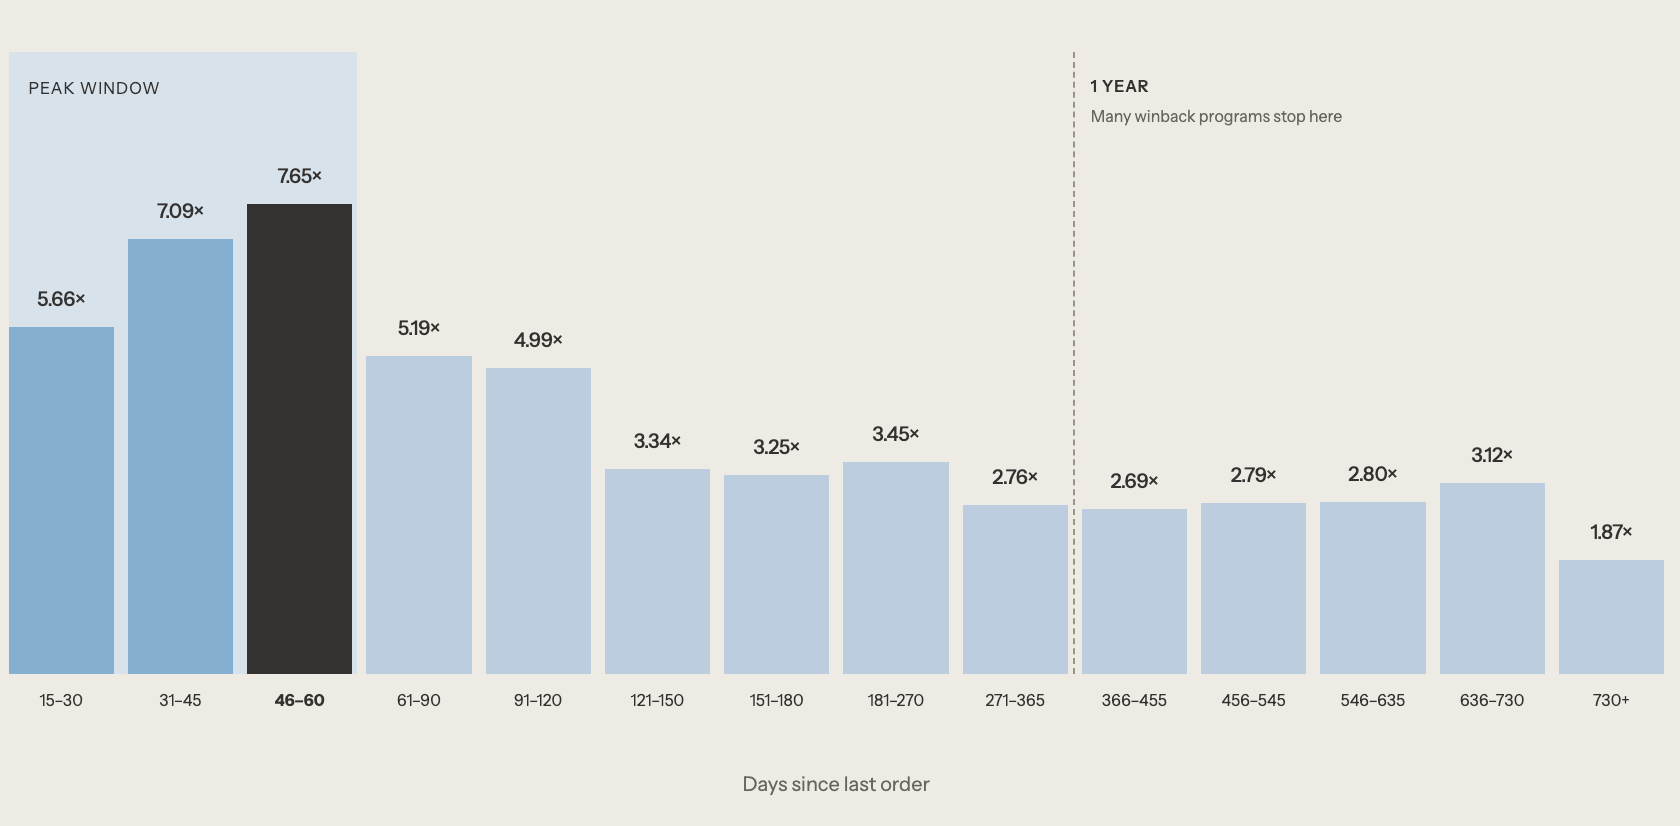
Median incremental ROAS by days since last order. Report, pp. 18–19.
Trigger mail 15–60 days after a purchase. Median iROAS peaked at 7.09–7.65× in the 31–60 day window.
Median iROAS stayed above 2.6× through day 730. Customers gone more than two years still returned 1.87×.
Automated campaigns outperformed comparable one-off sends.
of comparable one-off campaigns.
per recipient, compared with one-off campaigns.
Triggered by an abandoned cart, signup or purchase timing. Mail arrives at the right moment in the customer journey.
Set programs up in October. Pre-build creative and swap it in late November for the BFCM to post-BFCM switch.
The 15–60 day sweet spot from Chapter 02 becomes a trigger, so every new buyer gets mail on time.
The clearest automation dividend came after BFCM. Automated programs kept earning while everyone else went home.
Higher monthly mail spend was associated with higher median iROAS. Here’s how each tier compared with the $1k–$5k baseline.
of brands spending $50k+/month saw positive incremental returns.
97 in every 100 brands spending $50k+/month saw positive incremental returns
The strictest comparison in the report: a randomized group held out of every send, compared with identical customers who got the mail.
With a randomized group held out of every send, mail recipients generated 14.5% more revenue than identical customers who got nothing.
Higher AOV for mail recipients across all buyers we observed over the season. The mailer arrives carrying an offer, a bundle, or a product story that shapes what goes in the cart.
Three creative decisions with a measurable edge over BFCM.
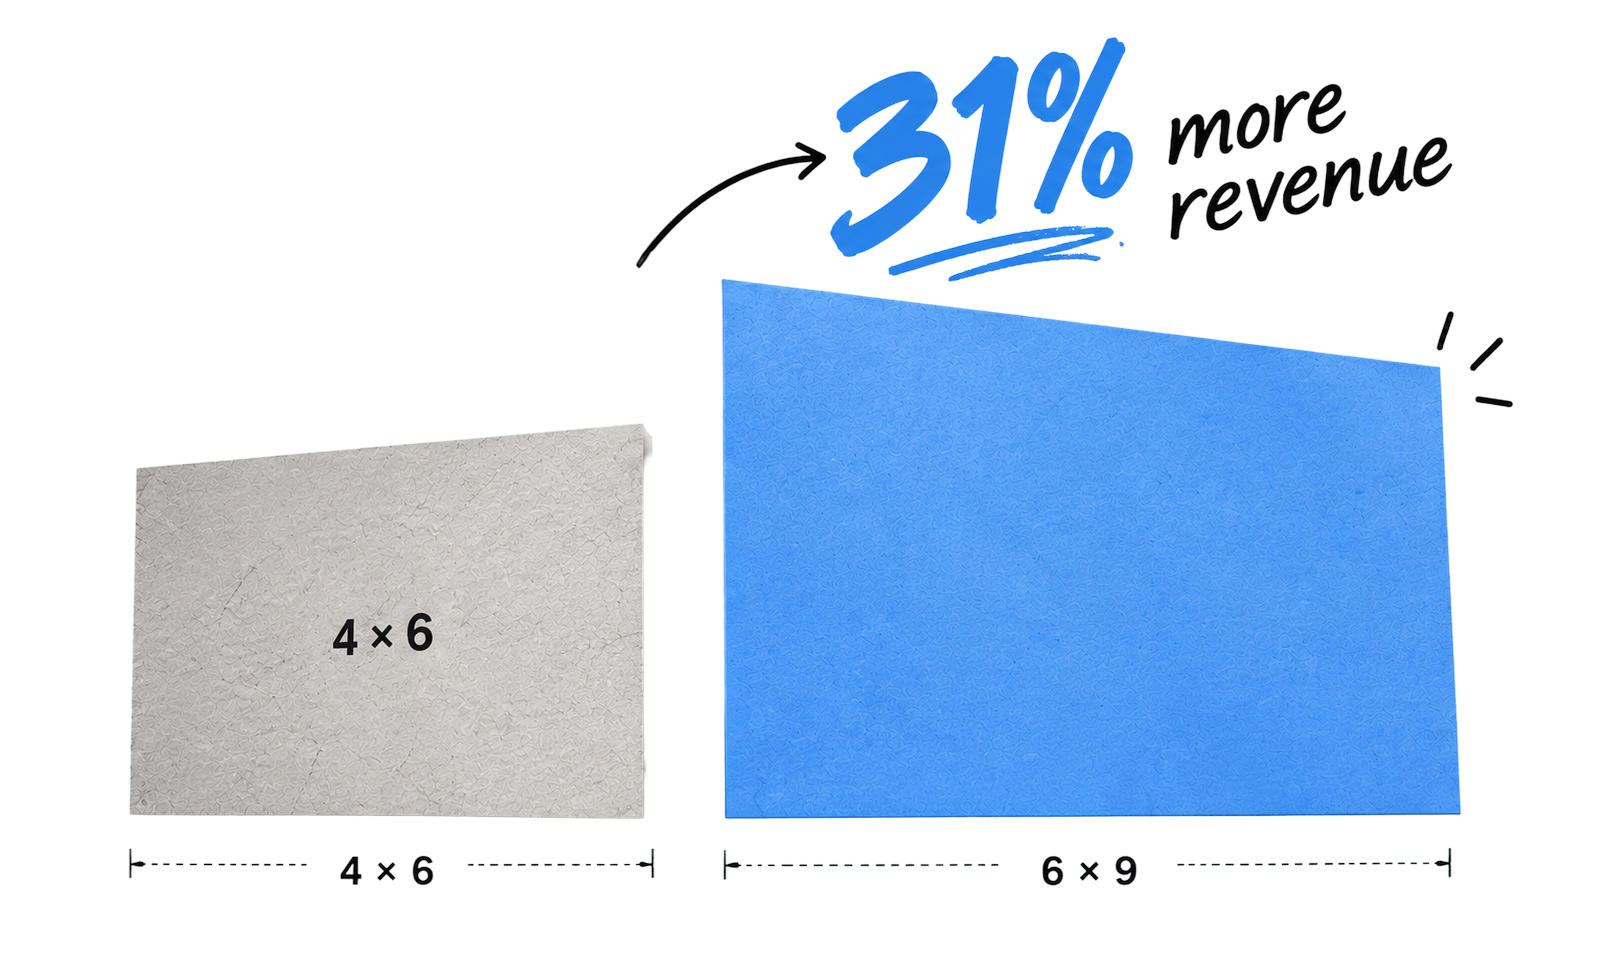
6×9 postcards beat 4×6 at the median, with a 21% higher median incremental return. When in doubt, size up.
Great for VIP campaigns, thank-you notes, and anywhere you’d write a customer a note by hand, minus the hand cramps.

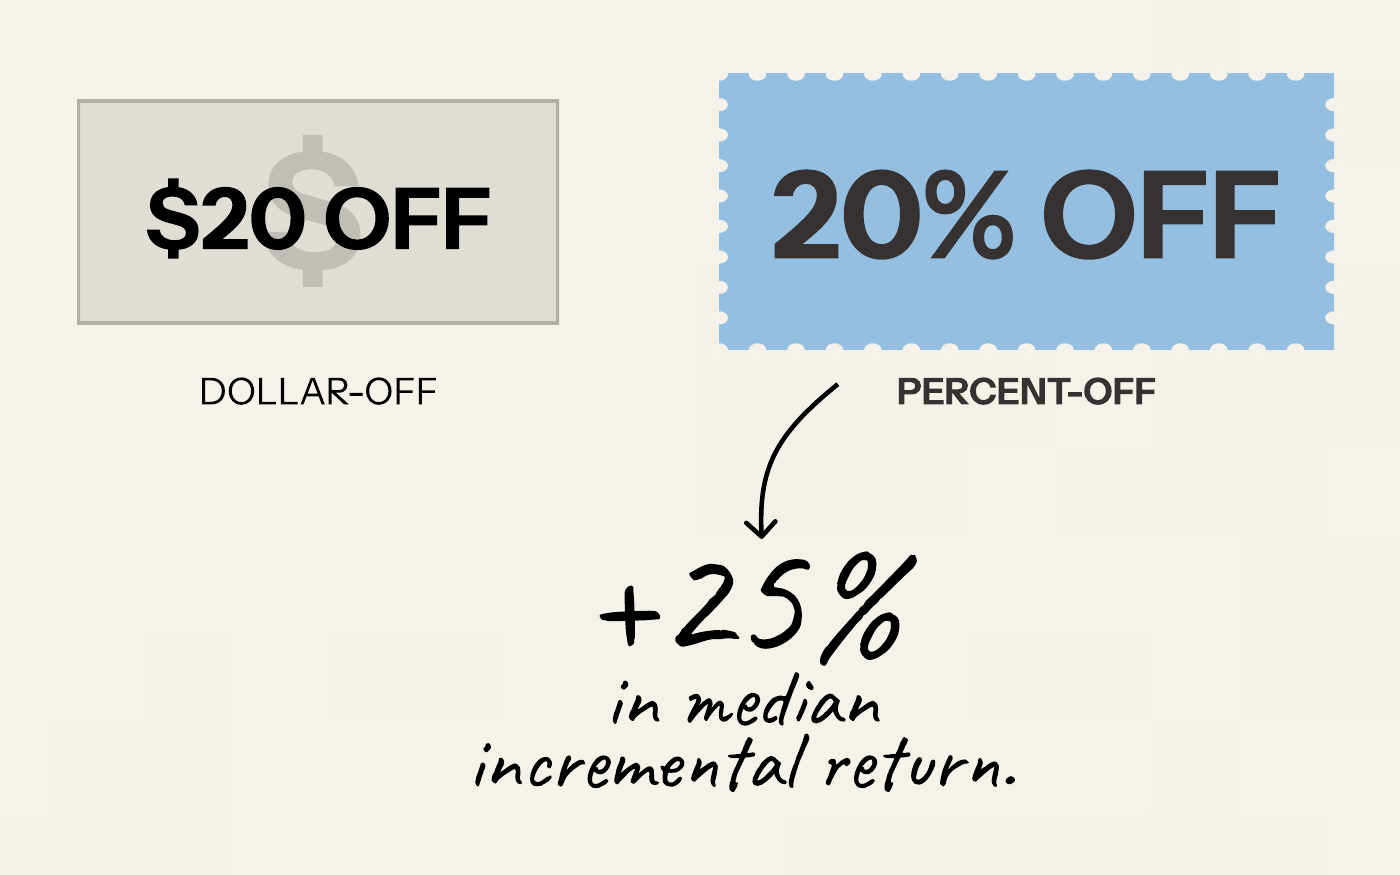
Percent-off beat dollar-off among campaigns with a classified discount, plus a 9% edge in revenue per piece. A percentage scales with the cart; a dollar figure reads as a cap.
Twelve brands across prospecting, retargeting and retention. iROAS results are incremental. ROAS and ROI are shown as each case study reported them.












Turn these benchmarks into your next campaign. PostPilot handles strategy, design, printing and mailing. Let’s build your BFCM plan.
This second edition analyzes PostPilot customer campaigns mailed October 1–November 20, 2025. Results are incremental and based on holdout testing wherever possible; most distributions use medians. The 3.89× headline is spend-weighted. Results vary by brand, audience and campaign.
Not every metric is holdout-tested: case studies use each brand’s reported metric.